Case Study: Pacer Corporation
December 2014
Benefit Summary
- Saving up to 20% on electric bills each month
- Using a smartphone with real-time graphing allows them to be in the plant watching the machines in order to analyze each machine’s energy use
- Ability to manage some operations from the comfort of the office
- Reduces wear on manufacturing equipment
- Increased efficiency of plant operations and power consumption
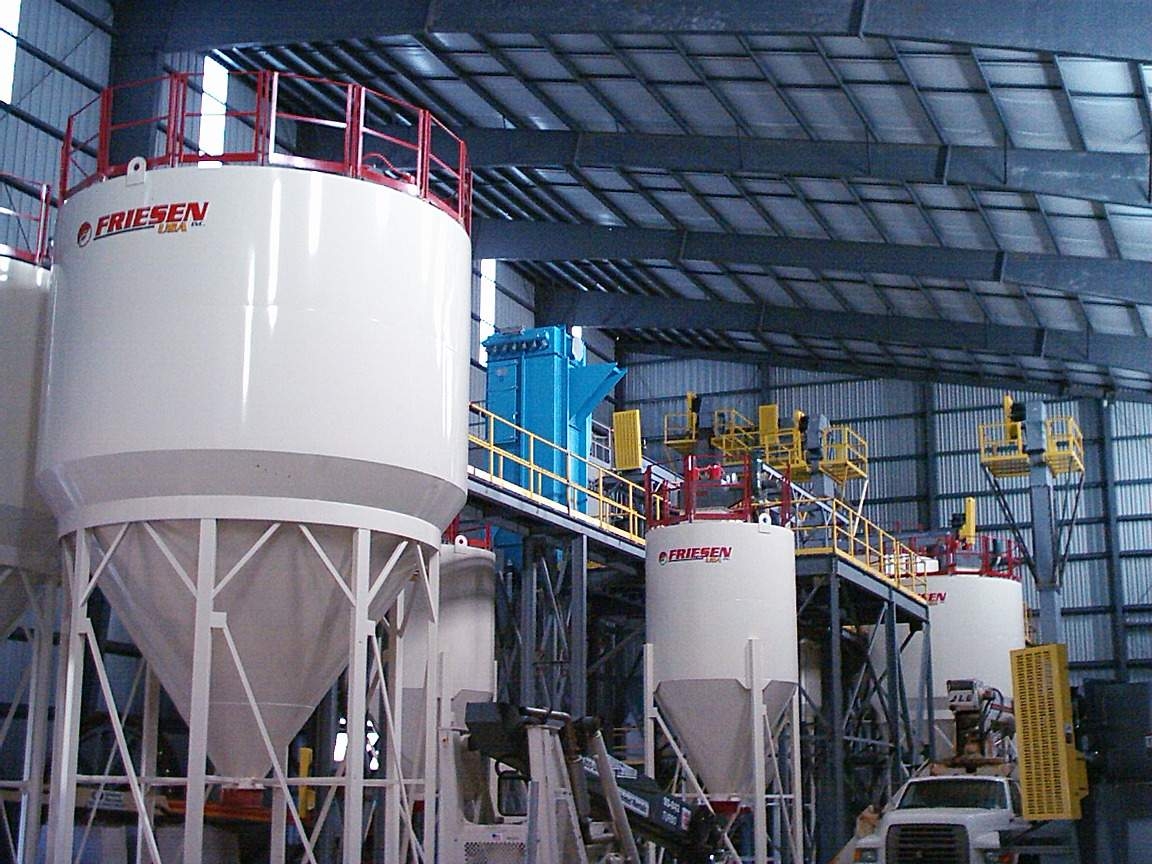
Pacer supplies high quality muscovite mica and potash feldspar for use in a wide range of applications including adhesives, fire retardants, sealants, powder coatings, plastics, and other construction and automotive applications. Their mica manufacturing plant located in Custer, South Dakota has been using PulseConnex for over a year to manage their peak demand. The plant is on Black Hills Electric Cooperative’s Time-of-Use Demand schedule.
To manage the peak demand, crew members at the plant manually turn off larger loads during on-peak times and schedule their use as not to interfere with operations and performance. They have used the data from PulseConnex to figure out which circuits and machines cause demand spikes and have adjusted their manufacturing process to manage these spikes. For example, in one of their data analysis, a plant manager at Pacer noticed a spike in energy use every five minutes. At this plant, there are two large dryer tanks that are powered by a 250hp machine that powered-up every five minutes. Using the real-time graphing of PulseConnex on a smartphone, employees were able to stand in the room with this machine and see an instant correlation between the powering-on of this machine and the spike in demand. With this information, Pacer adjusted the timing cycle of this machine from 5 minutes to 7½ minutes. Employees at Pacer note that this very small adjustment not only helps keep their demand in check, but also total power consumption is lower and that the life of this machine will likely be extended.
An unintended benefit is that plant managers can get a sense of what’s going on in the plant just by viewing the real-time graph. When a crew member turns on one of the larger machines, the real-time graph instantly shows an increase in power consumption. Also, workers are supposed to log when these machines are turned off and on, but they don’t always remember. Plant managers can look at the Profile History and fill in any missing log information.
Plant managers at Pacer have noticed significant savings up to 20% per month on their electric bills by using and acting on the data collected from PulseConnex. They are very happy with PulseConnex and intend to keep using it indefinitely.