 Real-Time Energy Dashboard
Do you have to wait for the electric bill before you know the amount of energy you used and how much it cost?
Is it difficult to decipher your time periods of high electric use?
How accurate is your electric bill? Is it difficult to verify?
How do outside conditions (like weather) affect your building?
If you answered yes to any of these questions… you may be suffering from a lack of Energy Information. Now there’s a simple, cost-effective, and convenient way to access and view your Real-Time energy information… PulseConnex.
Why PulseConnex?
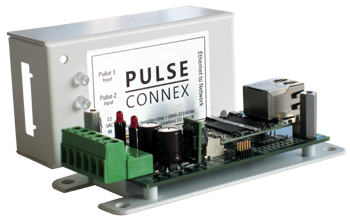
There are a few dashboards on the market, but most require expensive infrastructure and operating systems. PulseConnex is truly Plug & Play requiring only our “little white box.”
With a little knowledge about your energy use you’ll be able to:
- Set Limits
- Pinpoint Triggers
- Quickly Verify Bills
- Increase Efficiency
- Improve Budget Forecast
- Gain Control of your electric use
And so much more!
- Installation is as easy as connecting one end of the “little white box” to the meter and the other end to an Ethernet jack and the
PulseConnex Box automatically “phones home.” - No need for the IT department, expensive infrastructure, software or operating systems…
- Connect and view up to 2 sources of incoming pulses at once, providing the capability to quickly compare meters
- Use PulseConnex for anything that a pulse can count such as: kWh, kvarh, kvah, gallons, ccf, etc.
- “Cloud Based” – Access PulseConnex information anywhere there’s an internet connection by logging onto www.pulseconnexlogin.com.
- Receive Automated Load Profile reporting emailed to you daily.
- Export historical data to a CSV file to import into Excel or other software to use as you see fit.
- Receive text message and email alerts (if enabled) when approaching a predefined peak limit, informing you of high energy use wherever you are.
- Immediately view Real-Time pulse information – Anytime, Anywhere by logging onto www.pulseconnexlogin.com
- Pulse information is recorded and streamed almost instantaneously to the online PulseConnex account.
- All load profile information is stored on the PulseConnex database located on a major data center server for dependable access of historical data upto a year.
- If internet connection is lost or interrupted, the “little white box” will store data packages for up to 24 hours to ensure no pulse information is lost. Once internet connectivity is established, the data packages are immediately transferred to the PulseConnex database.
Easy to Use
Flexible
Instant
Reliable
Navigation
![]()
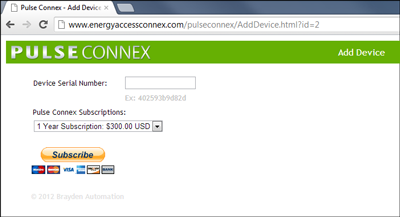
| Add Device | Enter the “little white box” serial number and choose either a 1, 2, or 3 Year Subscription. You will be directed to Pay Pal for secure credit card payment |
|---|---|
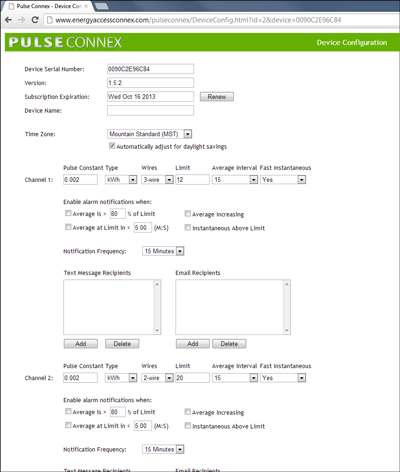
| Device Configuration | Set meter configurations such as time zone, pulse constant, alarms etc. You can go back and alter these settings at any time. |
| RT Graphing | Select this tab to see your energy use in Real-Time. You can view one or two channels simultaneously. |
| Profile History | On this tab you can view your daily Profile History. Scroll through different days of the month and compare areas of high and low electric use. |
| Date Range | When located on RT Graphing or Profile History page, you can scroll through different dates to view current and past history. |
Dashboard:
![]()
| PulseConnex Device | This is the name of your “little white box.” If you have multiple units you will see a list of options displayed in the drop-down menu. Select the device you would like displayed. |
|---|---|
Channel 1 |
Inst: This is the instantaneous demand Avg: This is the average demand Peak: This is the peak demand |
| Channel 2 | Same components as Channel 1 |
| Check Boxes | Check what features you would like displayed |
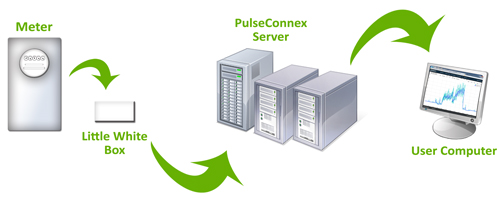
PulseConnex uses pulse information recorded by your meter and organizes the data into a more useful graphing format. The “little white box” is connected to the meter on one end by a 2 conductor control cable. The other end of the box is connected to the internet by an Ethernet cable and Ethernet wall jack. Once the device is properly connected, data is streamed from your meter to the PulseConnex database located on a major data center server. Information is then translated by our software into graph form that can be accessed online through your PulseConnex account. Pulse information can then be viewed in Real-Time or by Profile History to analyze energy use. PulseConnex can also notify you via text message and/or email alarms if you start approaching a high level of use. You specify at what point and how often you receive notifications.
Installation Instructions:
 Step 1:
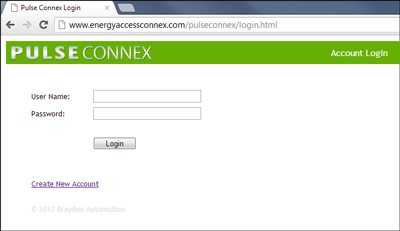
Create a username and password for your PulseConnex account
 Step 2:
Purchase PulseConnex account via Paypal
Only $25 a month!
 Step 3:
Enter Configuration settings for device (meter)
Step 4:
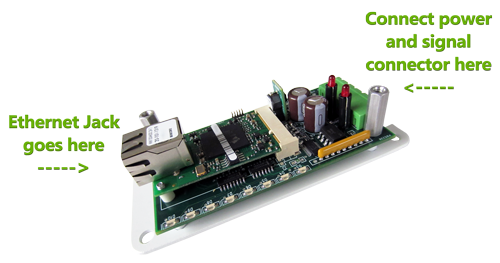
Install “little white box”
Connect one end of the “little white box” to the meter with the power and signal connector. This will provide pulse outputs from the meter.
Connect the other end to an Ethernet cord that is plugged into the nearest Ethernet jack.
You can now access instant pulse information and take control of your energy use!